
Reporting
If it’s in EXTAG, you can report on it
Reports, dashboards, forecasts and compliance views, built and managed by our team inside EXTAG and tailored to each solution.
All your reporting, in one place
Reporting is where EXTAG brings together everything your teams capture in the field. Compliance status, forecasts, utilisation, audits and history all sit in the same app your team uses to scan tags and complete forms.
- Compliance status. See what is compliant, due and overdue, from inspections and test and tag to calibration and servicing, with documents and certificates on each asset.
- Forecasting. Lifecycle forecasting, and planning reports such as the Cyclone Hours report, which compares the labour hours cyclone preparation will take against the people available on site.
- Utilisation. Find equipment that is under-used and could be redeployed.
- Audits and history. Audit and stocktake reconciliation against the register, a full audit trail, and proof of presence when a tag is scanned.
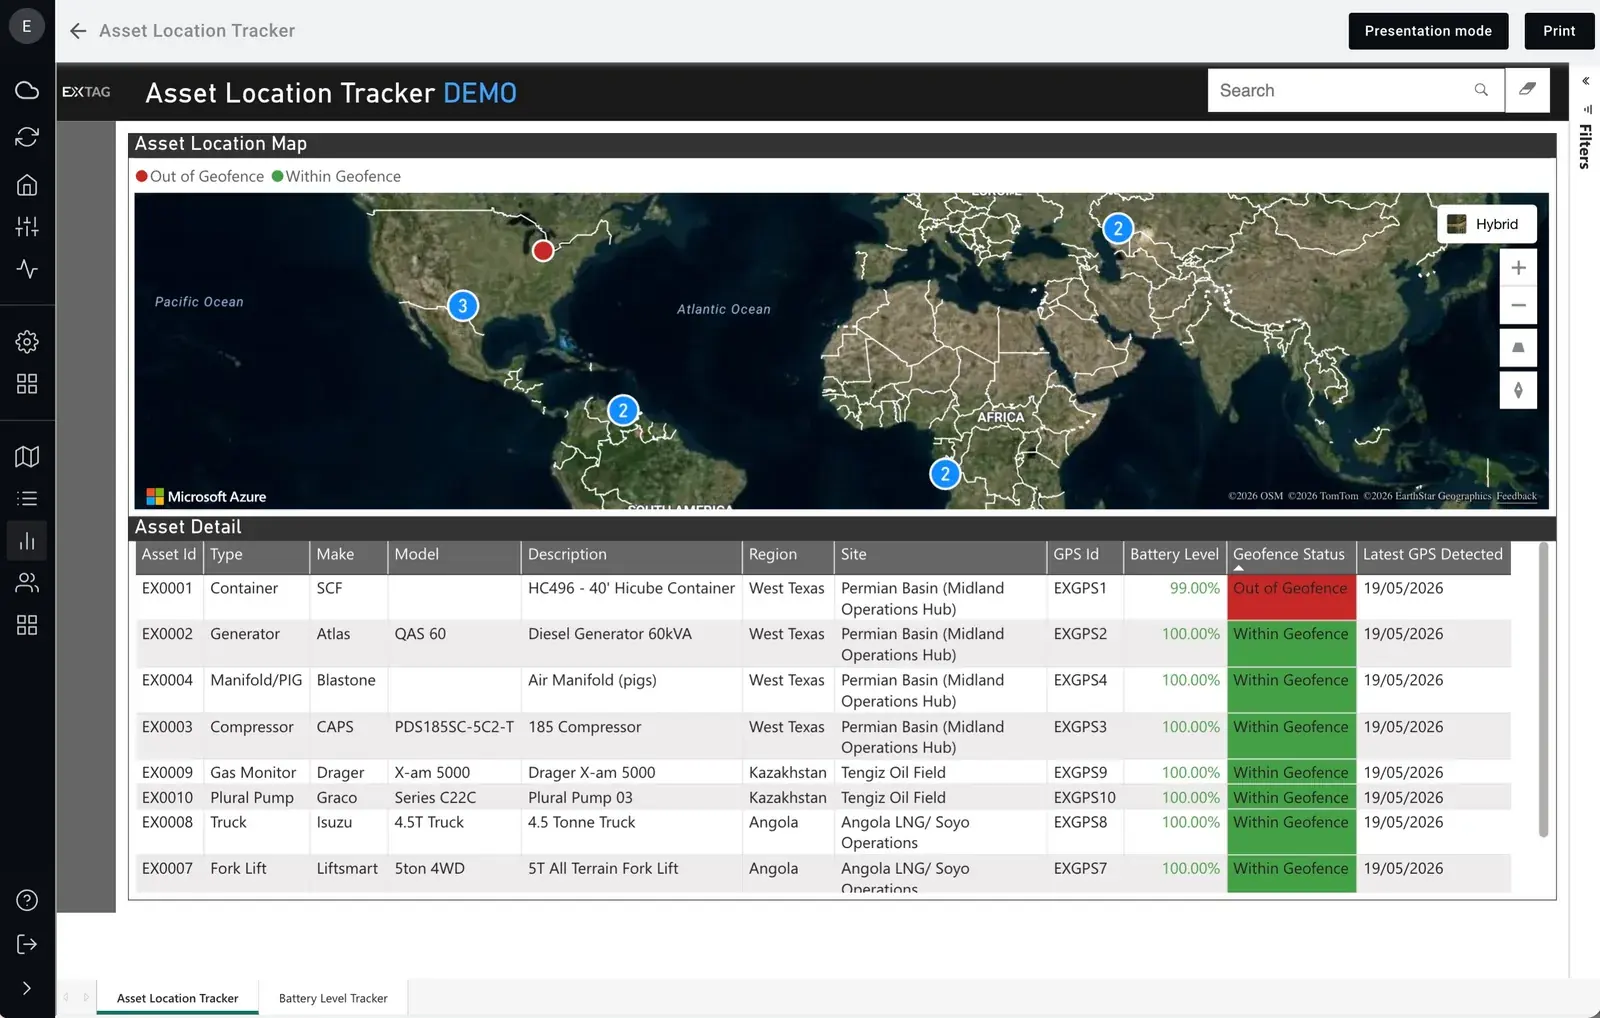
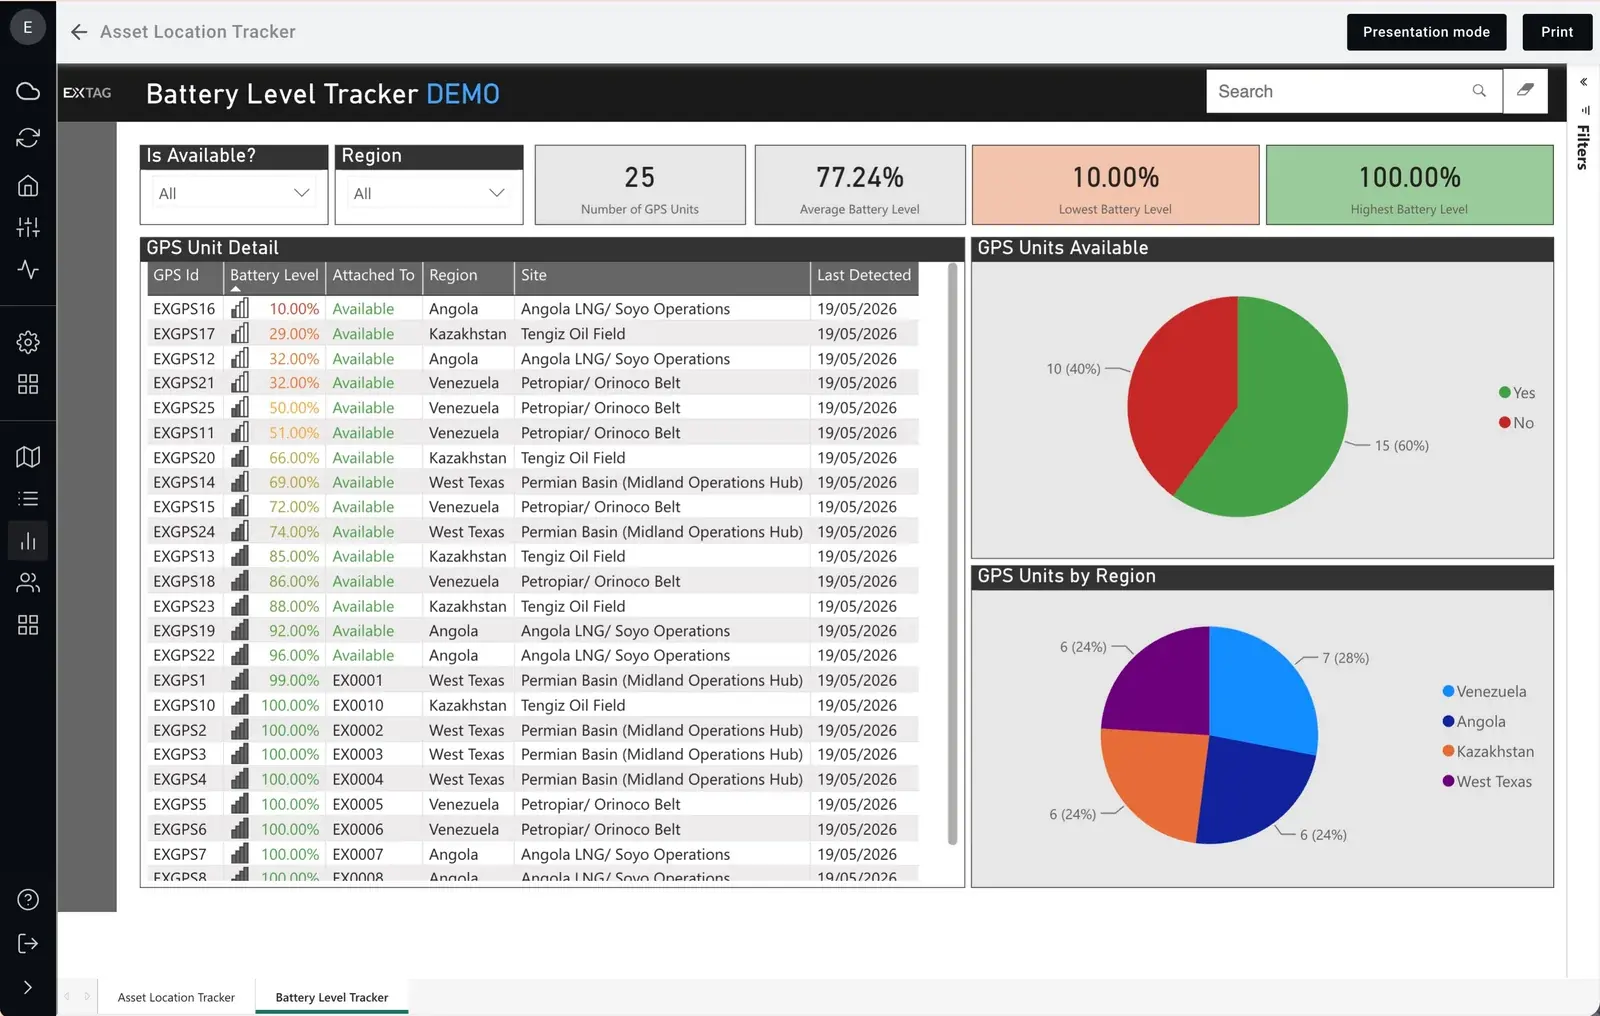
- Maps and scores. Colour-coded status pins on live maps, and calculated values that turn raw data into a score, a status or a risk rating, such as a traffic light. Valuation reporting too, where the data is captured.
What you can report on depends on the data captured, so if it is tracked in EXTAG, it can be reported on.
Powered by Microsoft Power BI
What is Power BI?
Power BI is Microsoft’s business intelligence and reporting tool, used by organisations around the world. It turns data into interactive dashboards and reports that you can filter, drill into, and print or export.
You don’t need to know Power BI to use EXTAG reporting. Our team builds the reports, and your team opens them in EXTAG.
What that means in EXTAG
- Embedded in EXTAG. Reports open inside the EXTAG app, built from the data your crews capture in the field. There is nothing extra to install or learn separately.
- Interactive. Use filters to narrow a report by site, type, status or date, and use presentation mode or print when you need to share it.
- Designed and managed for you. The EXTAG team configures, designs and manages your reports, and updates them as your needs change.
- Included in your EXTAG licence. No separate Power BI licence is needed to view your EXTAG reports.
- Refreshed when you need it. Data can refresh live, hourly or daily, depending on the report.
- Your own Power BI, if you want it. We can also connect EXTAG data to your own Power BI environment as an integration. See AI and integrations.
Examples
A few examples
These are just a sample. Every solution is different, and anything tracked in EXTAG can be reported on.
-
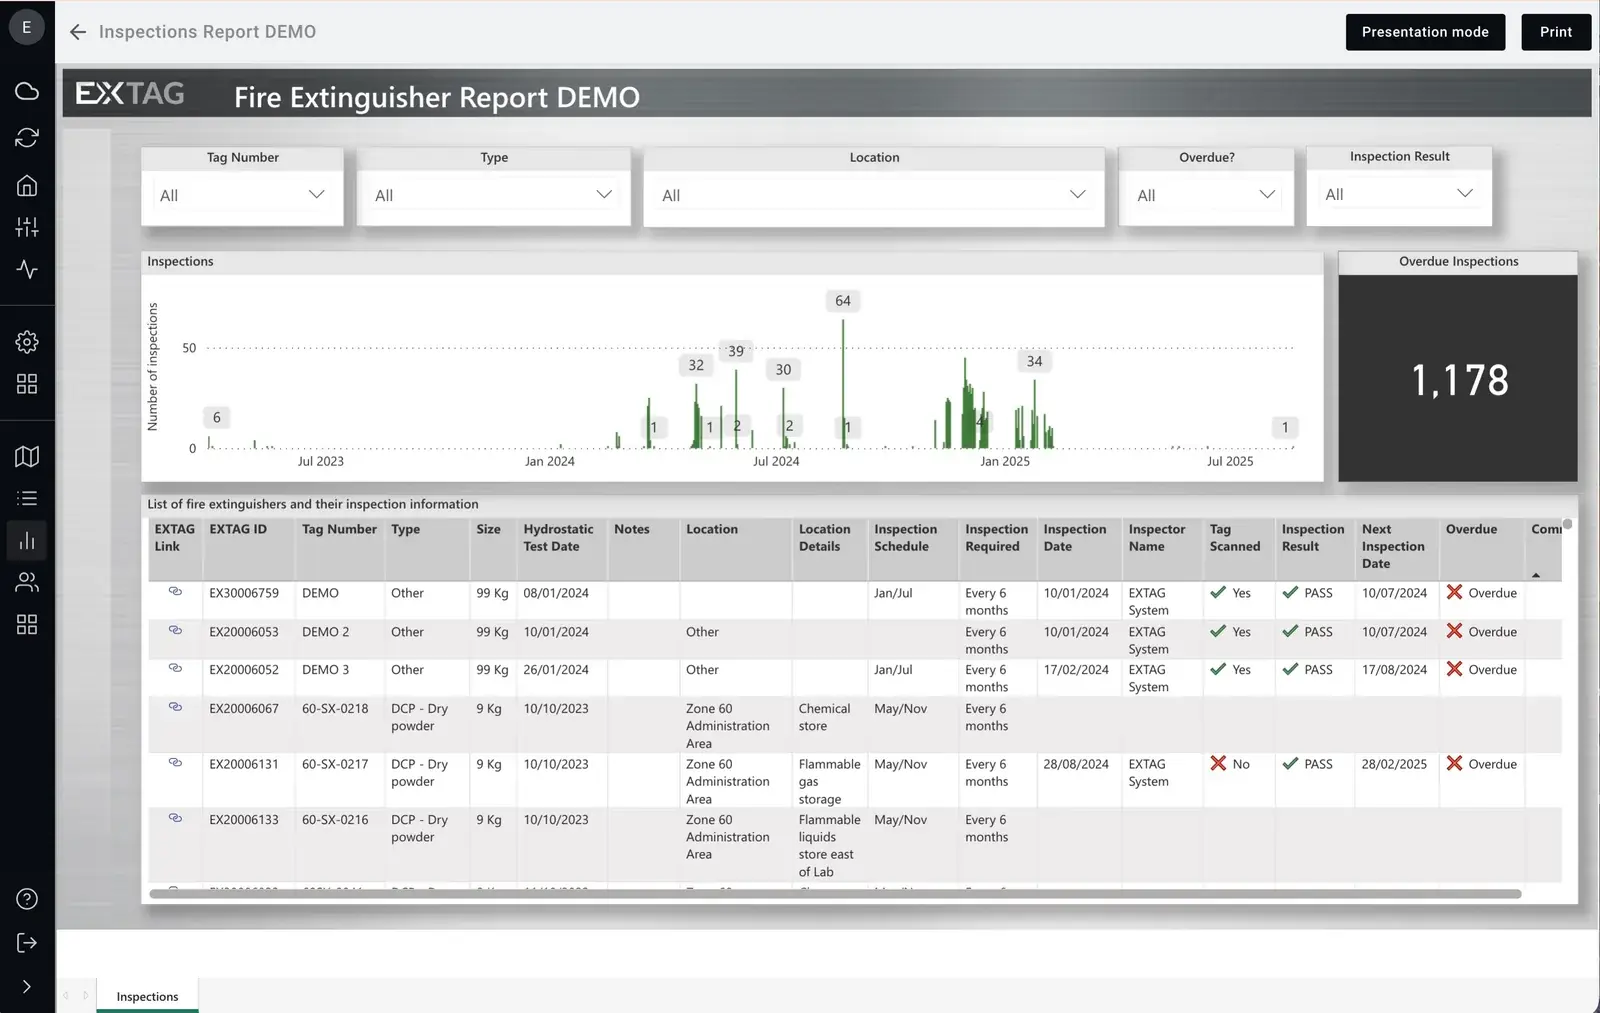
Overdue inspections
See which inspections are due, overdue or done, by site, area or asset type.
-
Test and tag due dates
Know what is coming up for test and tag before it lapses, not after.
-
Hours and odometer servicing
Track servicing triggered by hour meter or odometer readings, and what is due next.
-
Checked-out equipment
See who has what, where it was last scanned, and which items are overdue for return.
-
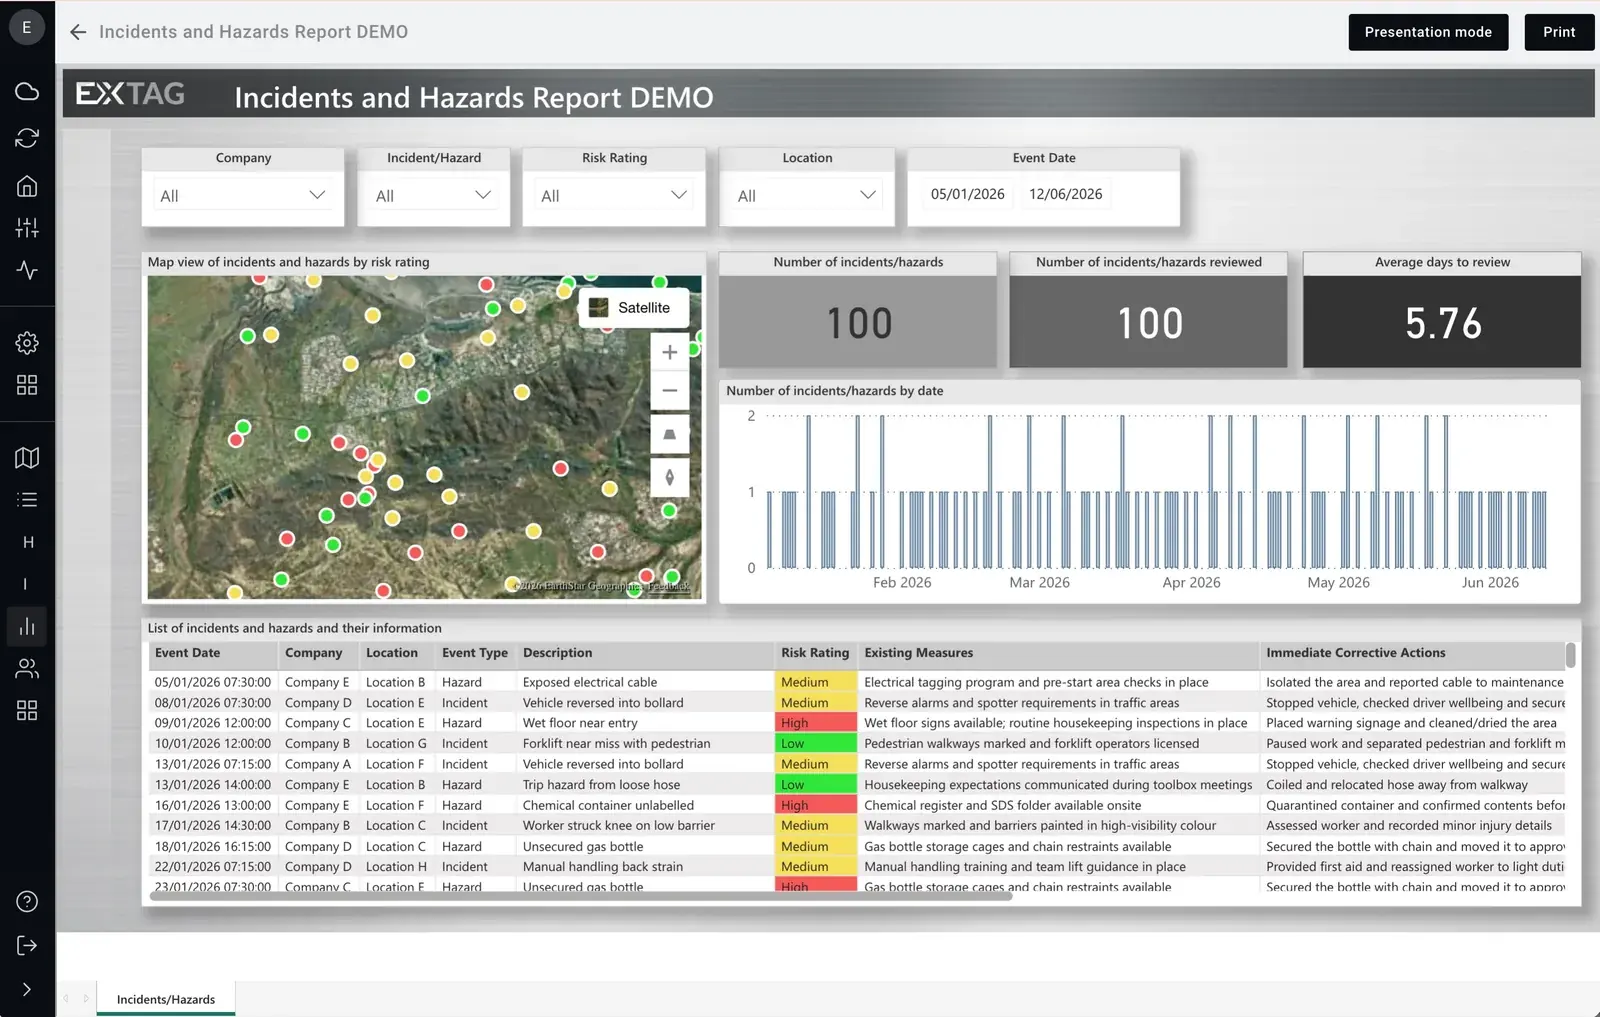
Incidents
Follow incidents and issue reports from the first report through to close-out.
-
Actions with proof of presence
See each completed Action, who did it, and whether the tag was scanned to prove they were at the asset.
Reporting for each solution
EXTAG is one platform with a separate, tailored implementation for each area. Each implementation has its own access, its own team and its own reporting.
Your scaffolding team sees scaffolding reports, and your workshop sees servicing and test and tag. Where you want a wider view, data can be rolled up through the asset hierarchy. Read more about one platform, many solutions.
Role-based access
Access to reports is role-based, so people see the dashboards that match their role, team and site.
Reporting FAQ
- What can EXTAG report on?
- Anything tracked in EXTAG, including compliance status, inspections and servicing due, forecasting such as the Cyclone Hours report, utilisation, audits and proof of presence. It depends on the data captured.
- What is Power BI?
- Power BI is Microsoft’s business intelligence and reporting tool, used by organisations around the world. It turns data into interactive dashboards and reports you can filter, drill into, and print or export. In EXTAG it is embedded in the app and our team builds the reports, so you don’t need to know Power BI to use them.
- Is reporting included?
- Yes. Reporting is included in your EXTAG licence. It uses Microsoft Power BI embedded in the EXTAG app, and your team does not need separate Power BI licences to view EXTAG reports.
- Who builds the reports?
- The EXTAG team configures, designs and manages your reports, forecasts and dashboards, based on what each team needs to see.
- Can we use the data in our own Power BI?
- Yes. If you want EXTAG data in your own Power BI environment, we can connect to it as an integration.
- How often does the data refresh?
- Live, hourly or daily, depending on what the report needs.
- Who can see which reports?
- Access is role-based. Each implementation has its own access, team and reporting, so people see the reports that are relevant to them.
Tell us what you need to report on
We'll show you how it could look in EXTAG, for your solution.